A Summary of Four Proposals from the Legislature’s Tax Working Group
December 14, 2015
Context
Idaho lawmakers face multiple pressures when it comes to tax policy. The outgoing Department of Commerce Director, Jeff Sayer, has cautioned against further tax cuts and has encouraged increased investments to develop a pipeline of talented workers. Businesses looking to expand in Idaho or relocate to our state have expressed a deep concern about meeting their workforce needs and little interest in tax rates. Similarly, business leaders, legislators, and education experts participating in the Governor’s Task Force for Improving Education have recommended a list of priority investments with a total price tag of about $350 million. At the same time, several Idaho business groups are lobbying for cuts to income taxes and increases to the personal property tax exemption, both of which would reduce revenues available for education.
Idaho’s total tax collections per person are the second lowest in the country.[1] In a national state ranking for economic climate, Idaho excels in the Cost of Doing Business category at 6th in the nation. This category includes the cost of taxes. That same ranking puts Idaho at 47th for Education, 33rd for Technology & Innovation and 32nd for Workforce.[2]
Within this context, the Legislature’s Tax Working Group is considering four proposals that could reduce state revenues by up to $64.5 million a year, and cost local governments another $21.4 million. All of the proposed policies would provide larger benefits to high-earning individuals and businesses than to Idahoans who are middle-class or earn lower wages.
Proposal #1: Reduction of top individual income tax rate to 7.3% from 7.4%
Idaho has a graduated personal income tax, with rates increasing with household income. This has a balancing effect on the sales and property taxes, which generally cost middle and lower-earning households a larger share of their income.
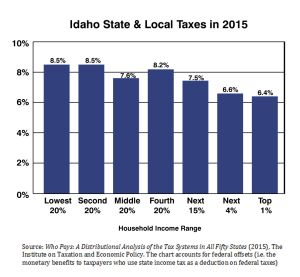
When all state and local taxes are combined, Idaho’s tax distribution is relatively even across the income spectrum, although the top 20% of earners pay less in taxes as a percentage of family income.

Forty-three states and the District of Columbia levy an income tax. The remaining states must rely more heavily on other taxes. Idaho’s income, sales, and property taxes each generate roughly the same amount of revenue, forming a tax structure that is balanced across its so-called ‘three-legged stool.’
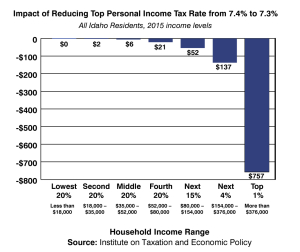
A current proposal would decrease the tax rate on the top income bracket to 7.3% from 7.4%. The top 5% of earners (households earning more than $172,800 per year) would receive almost 50% of the benefits of the tax cut.
The chart below depicts the average tax cut within each household income range. For example, the middle 20% of households will have an average tax cut of $6 per year, while the top 1% of households will see a $737 tax cut, on average.

A variety of circumstances (e.g. deductions and credits) will determine the exact impact of the tax cut on a given household.
Fiscal Impact:
In the first year, the income tax cut would reduce General Fund revenue by $20.7 million.
Proposals #2 and #3: Increase the personal property tax exemption to either $150,000 or $250,000
The personal property tax is levied on such items as machinery, tools, and other kinds of equipment owned by a business. It is distinct from the real property tax, which essentially applies to business and residential real estate. Both taxes provide local jurisdictions with the resources for schools, police, emergency response, and other services.
Beginning in 2013, the Idaho Legislature allowed businesses to exempt the first $100,000 in personal property from taxes. This exemption allowed the vast majority of Idaho businesses to exempt the entire value of their personal property, and owe no tax.
One of the draft proposals would increase the personal property tax exemption to $150,000; the other to $250,000.
Fiscal Impact:
The proposed legislation would make up for revenue reductions to local units of government by replacing those dollars with state sales tax revenue. Such a swap would mean less sales tax revenue flowing into the General Fund. Increasing the personal property tax exemption to $150,000 would reduce General Fund revenue by $4.4 million a year. Increasing the personal property tax exemption to $250,000 would reduce it by $10.5 million.
Proposal #4: Grocery Tax Credit Swap for a Sales and Use Tax Exemption on Food
This proposal would eliminate Idaho’s grocery tax credit and create an exemption for sales and use tax for food.
Idaho households today can apply for a refundable tax credit whether or not they make enough in a year to file a state income tax return. The value of the credit is $100 per person, so a household of five receives $500. Seniors age 65 and older receive $120.
Because the cost to the state of providing the grocery tax credit is less than the revenue collected from taxing food sales, this proposal will cause the state and local governments to lose $55.6 million in the first year. Since higher income households tend to spend more on food on average, the monetary benefits of this proposal are concentrated at the top of the income spectrum.
Tourists and other non-residents would also benefit from this legislation since they currently pay sales tax on grocery purchases but cannot claim the grocery tax credit.
The grocery tax and credit provides stability to the state’s cash flows because food is purchased steadily throughout the year, in contrast to seasonal taxable purchases (for example, Christmas gifts in the winter). When Utah reduced its sales tax on food, analysts noted that revenue was more erratic over time.
Fiscal Impact:
The loss of revenue would be $55.6 million a year. That loss is split between the General Fund ($34.2 million) and local units of government ($21.4 million). The reduction to local units of government results from eliminating the sales tax on food. Since food prices generally rise over time and the grocery tax credit is fixed, the revenue loss from this legislation increases in future years.
Notes:
[1] U.S. Census Bureau. Derived from state and local own-source general revenue per capita in FY2013.
[2] America’s Top States for Business 2015: A scorecard on state economic climate (CNBC). Available at: http://www.cnbc.com/2015/06/24/americas-top-states-for-business.html


